
Back to Exhibits
TALE OF THE TABLE


A display of periodic tables from the 1700s up to the present day, designed by physicists, chemists and other scientists. From Dalton’s table of elements, to modern day 3D representation, this exhibit shed light on the various attempts to categorise and classify elements. It also showcased the predictions for future discoveries of elements. The images showcased in the exhibit were procured through the Science History Institute.

Table of Affinities
1718, Étienne-François Geoffroy (France)

Dalton’s Table
1808, John Dalton (England)
In 1803, the English school teacher and part-time scientist, John Dalton published his first list of elements when he printed his atomic theory and his early gas law work. His original list showed only five elements: hydrogen, oxygen, azote (nitrogen), carbon and sulfur, along with their atomic weights.
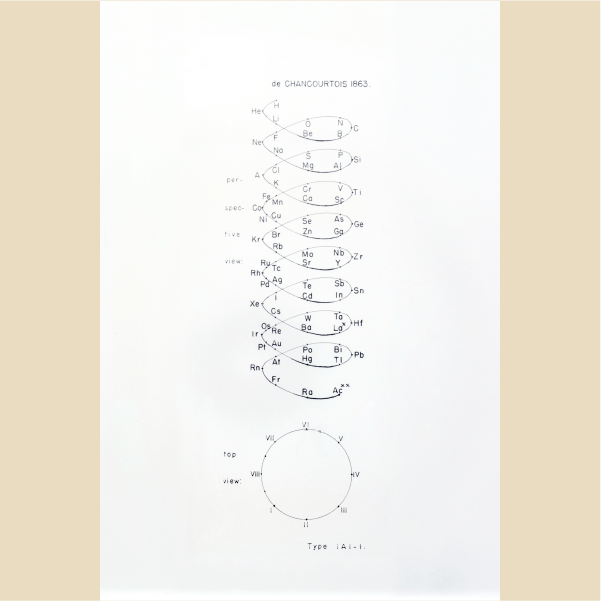
Helix on one cylinder
1863, Alexandre-Émile Béguyer de Chancourtois (France)
Top and perspective views of a graphic representation of the periodic table of chemical elements depicted as a helix drawn on a single cylinder. This table was originated by French geologist and mineralogist Alexandre-Émile Béguyer de Chancourtois (1820-1886) in 1863.

Mendeleev’s Periodic Table
1871, Dimitri Mendeleev (Russia)
Mendeleev realized that the physical and chemical properties of elements were related to their atomic mass in a 'periodic' way, and arranged them so that groups of elements with similar properties fell into vertical columns in his table. Sometimes this method of arranging elements meant there were gaps in his horizontal rows or 'periods'. But instead of seeing this as a problem, Mendeleev thought it simply meant that the elements which belonged in the gaps had not yet been discovered

Spiral with Varying Sizes of Revolutions
1926, C. J. Monroe and W.D. Turner (United States)
Graphic representation of the periodic table of chemical elements in the style of a spiral with varying sizes of revolutions. This table was put together by C.J. Monroe and W.D. Turner in 1926.

Left Step Periodic Table
1928, Charles Janet (France)
Charles Janet is known almost exclusively for his left-step periodic table (LSPT). A study of his writings shows him to have been a highly creative thinker and a brilliant draftsman. His approach was primarily arithmetic-geometric, but it led him to anticipate the discovery of deuterium, helium-3, transuranian elements, antimatter and energy from nuclear fusion.
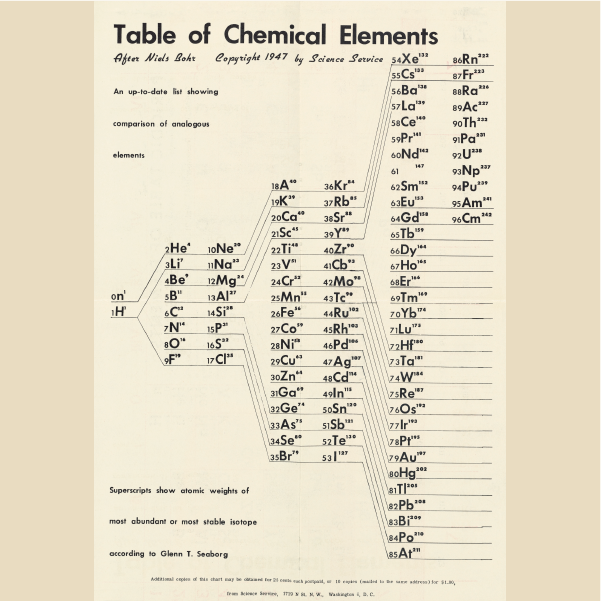
Seaborg's Updated Table
1947, Glenn Theodore Seaborg (United States)
Seaborg and his collaborators synthetically manufactured several new elements with atomic numbers beyond uranium, the last naturally occurring element in the table. He saw that these elements, the transuranics (plus the three elements preceding uranium) demanded a new row in the table.

Periodic Relationships
1975, James Franklin Hyde (United States)
James Franklin Hyde was an organosilicon chemist, so he gave silicon the centre stage, highlighting how connected this element is to many others in the table. But the table still starts in the centre of the right circle with hydrogen, before spiraling out into the different groups.

The Step-Pyramid Form
1987, William B. Jensen (United States )
A 32 column version of the step-pyramid form of the periodic table designed by William Jensen for use in an advanced level inorganic chemistry course.

3-D Periodic Chart
N.D., David C. Milford (United States)
A 3-D Periodic chart designed to be cut out and folded designed by David C. Milford.

About the Science History Institute
The Science History Institute collects and shares the stories of innovators and of discoveries that shape our lives. They preserve and interpret the history of chemistry, chemical engineering, and the life sciences.


